Home
Home
 About Us


Practices of Anti-subsidy investigation by Canada
09/05/2024 03:00
Due to the complex nature of the investigation compared to Anti-Dumping measures, Anti-subsidy measures are less often used. there has been a sharp increasing trend in the number of anti-subsidy investigations since 2010. In 2020, the total number of countervailing investigations reached a peak with 56 cases. However, from 2021 to 2022, the number of cases has decreased significantly to only 18 cases in 2021 and 19 cases in 2022.
Chart 1: Anti-subsidy investigation initiated over the years (1995-2022)
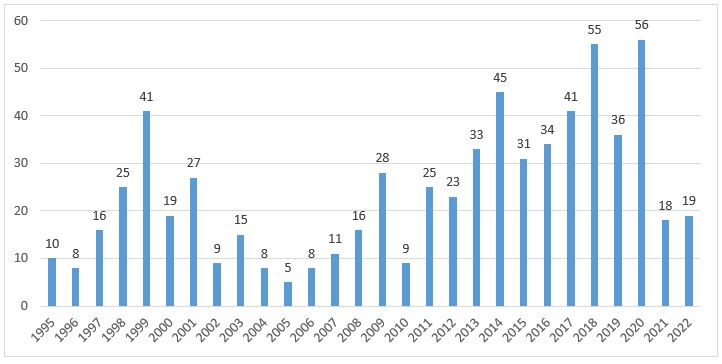
Source: WTO statistics
The United States is the largest user of Anti-subsidy measures with 311 initiations and 212 impositions, followed by the EU (93 initiations, 49 tariff impositions) and Canada (79 initiations, 42 tariff impositions). It is clear that developed countries use countervailing measures more often, although the total number of Anti-subsidy investigations is still much less than that of Anti-Dumping investigations.
Chart 2: Top economies using Anti-subsidy measures the most (1995-2022)
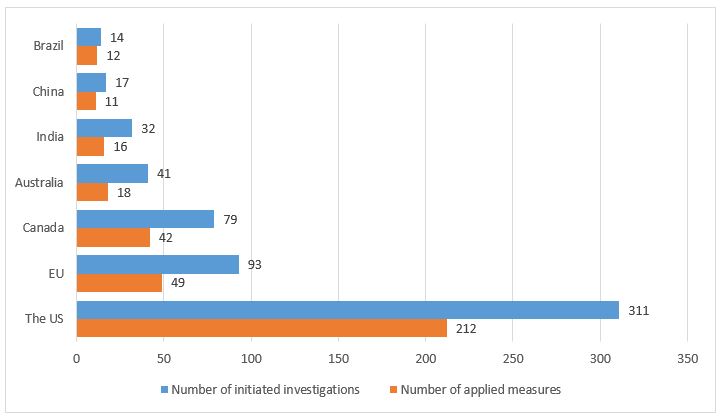
Source: WTO statistics
Top countries/territories subject to the most Anti-Subsidy measures by Canada
Canada started its Anti-subsidy investigation in 1995 with three investigations. In recent years, Canada has had a low number of Anti-subsidy investigations, with only 1 investigation in 2021 and 2 investigations in 2022.
Chart 3: Anti-subsidy investigations by Canada: initiating and imposing (1995-2022)
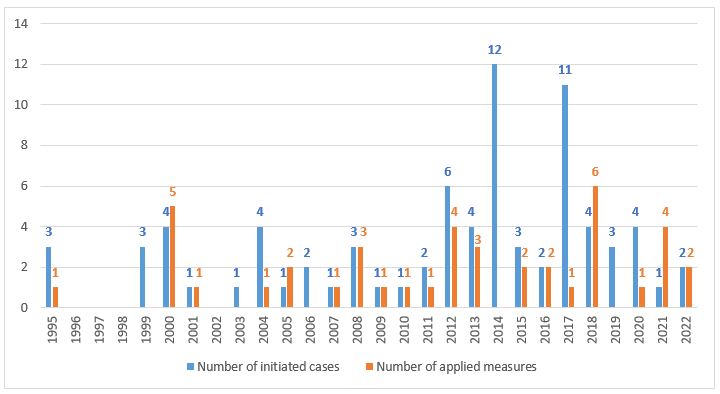
Source: WTO statistics
According to WTO statistics, China, India, and Vietnam are the three countries most investigated for Anti-subsidy by Canada, accounting for 39.2%, 8.9% and 6.3% of the total number of Anti-subsidy investigations initiated by Canada, respectively. These are also the three countries that are subject to the most Anti-subsidy measures by Canada.
Table 1: Top countries/territories subject to the most Anti-subsidy measures by Canada (1995-2022)
|
|
Number of initiated cases |
Number of applied measures |
|
China |
31 |
25 |
|
India |
7 |
6 |
|
Vietnam |
5 |
3 |
|
Turkey |
4 |
2 |
|
Others |
32 |
6 |
|
Total |
79 |
42 |
Source: WTO statistics
Sectors subject to the most Anti-subsidy measures by Canada
According to WTO statistics from 1995-2022, base metals and articles are subject to the most Anti-subsidy duties globally, accounting for 50.6% of all imposed measures, followed by chemical and allied industries (accounting for 9.2%); plastics and rubber (accounting for 7.7%).
Chart 4: Top sectors subject to the most Anti-subsidy measures globally (1995-2022)
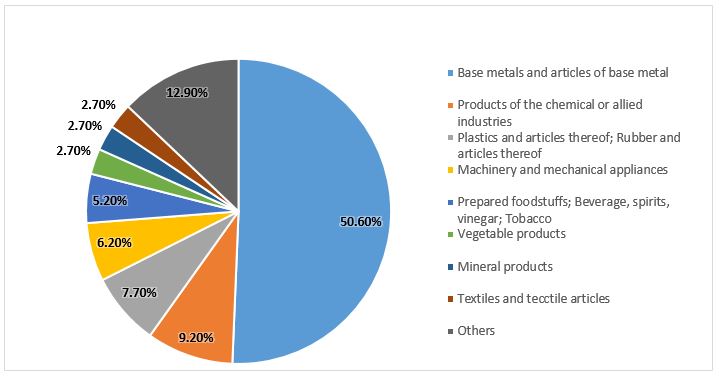
Source: WTO statistics
In Canada, base metal is the product subject to the most Anti-subsidy measures (accounting for 71.4% of the total 42 cases subject to Anti-subsidy duties in this country), followed by machinery and electrical equipment (accounted for 7.1%).
Table 2: Top sectors subject to the most Anti-subsidy measures by Canada
|
Sector |
Number of applied measures |
Ratio |
|
Base metals and articles of base metal |
30 |
71,4% |
|
Machinery and mechanical appliances |
3 |
7,1% |
|
Others |
9 |
21,4% |
|
Total |
42 |
100% |
Source: WTO statistics
Source: Center for WTO and International Trade - VCCI
Các tin khác
- The practice of Canada's trade remedy investigation against Vietnam (09/05/2024)
- Trade Remedy Investigations Against Exports From Canada (09/05/2024)
- Practices of Safeguard investigation by Canada (09/05/2024)
- Practices of Anti-dumping investigation by Canada (09/05/2024)
- Overview of Trade Remedies investigation by Canada (09/05/2024)